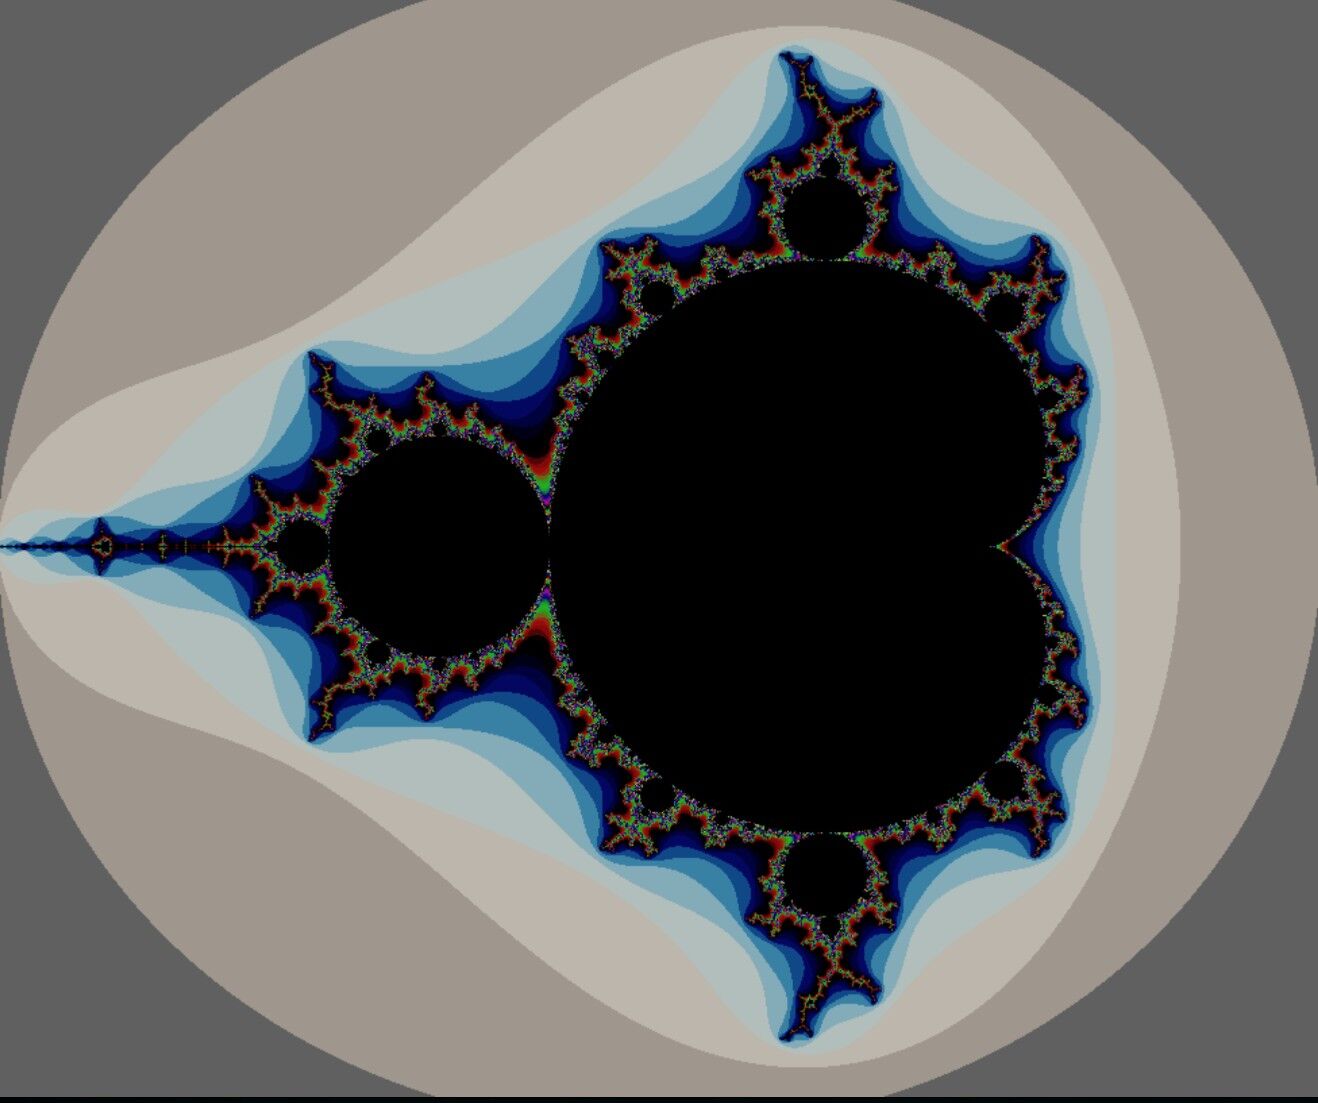
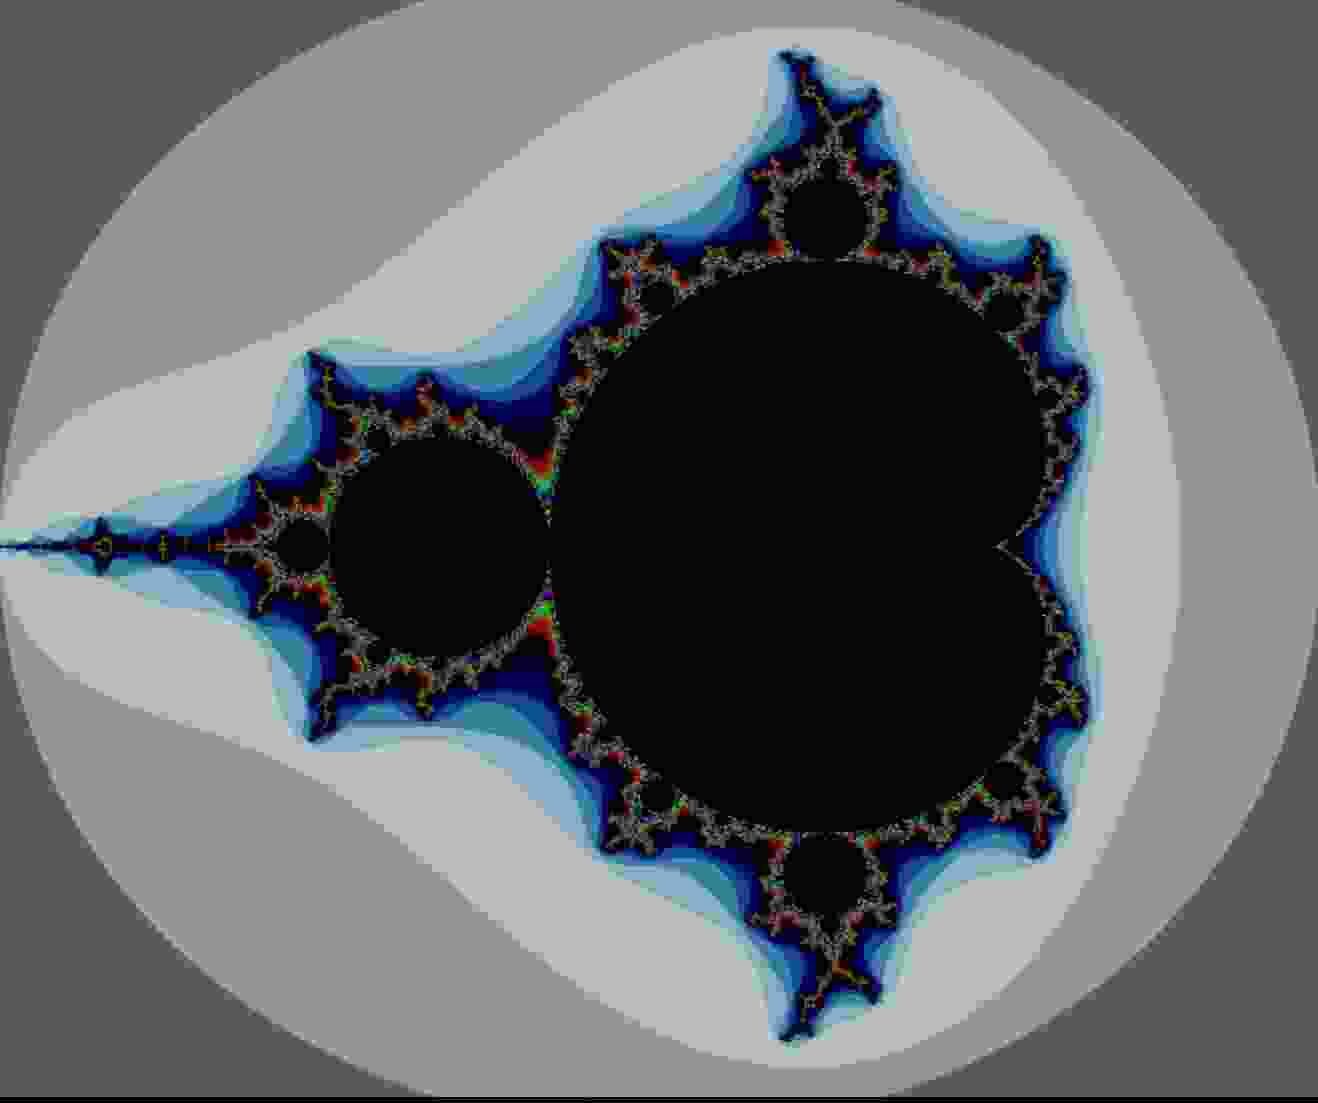
In my exchange semester at UW I took a course on data visualization and interactive explanations. The final project was an educational website, which actually won the class votes as best project. So if you want to learn about the Mandelbrot set, check it out at this link. The technology is plain HTML, CSS, JavaScript and web workers. No fancy library, all handcrafted to generate those stunning Mandelbrot visualizations.
Back to projects for more. This project was created during my exchange semester.